


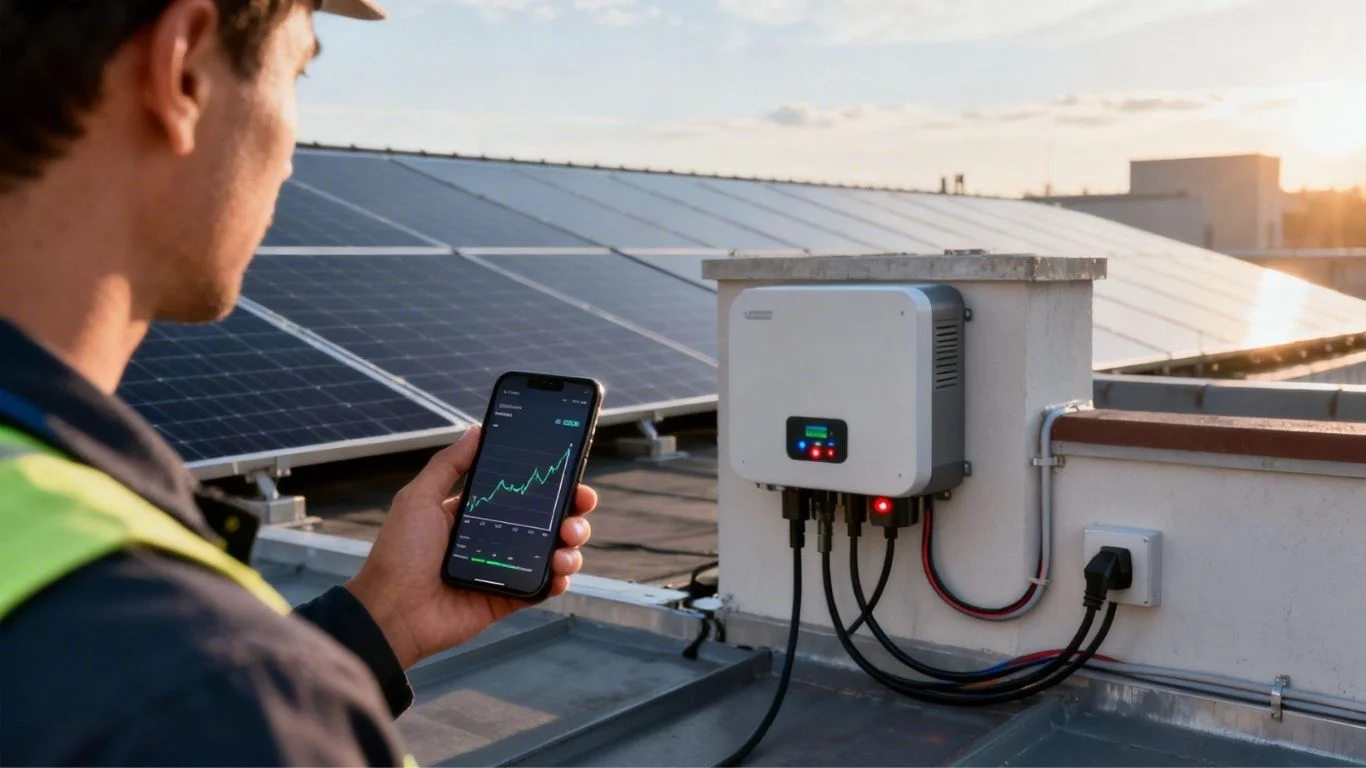
Solar panels can generate electricity throughout the day, but knowing how much energy your home produces is only part of the picture. To get the most from your system, you also need to understand how much electricity your household uses, when you use it, and how much power you draw from the grid.
Solar Energy Usage Monitoring Canberra helps homeowners track these patterns and make better decisions about everyday electricity use. By reviewing your solar production, household consumption, grid imports and energy exports, you can identify opportunities to improve efficiency and reduce unnecessary electricity costs.
Canberra’s changing seasons make this especially useful. Cold winter mornings, hot summer afternoons and increased heating or cooling demand can all affect how your home uses electricity. Monitoring gives you a clearer view of these changes and helps you understand whether your solar power system is meeting your household’s needs.
This guide explains how solar energy monitoring works, which figures matter most, how to interpret monitoring data and how Canberra homeowners can use these insights to manage household energy more effectively.
What Is Solar Energy Usage Monitoring?
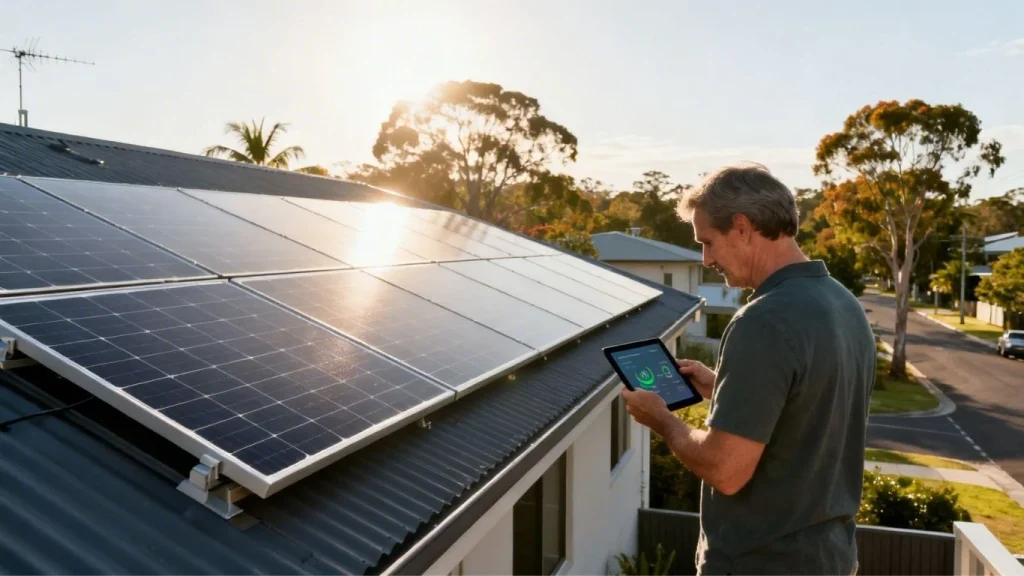
The use of solar energy is being monitored.
Solar energy usage monitoring is the act of monitoring the electricity generated by the solar panels and how that electricity is being used around the home. A monitoring platform could display solar generation, electricity consumed by the home, electricity supplied from the grid, electricity supplied to the grid and charge/discharge of the battery depending on the equipment installed.
Some simple inverter screens might indicate the current output of the panels. A connected app can present a more comprehensive view, such as daily totals and historical trends. If one of these systems is equipped with a compatible consumption meter, then it could also calculate or measure the consumption of electrical energy in the house.
The distinction matters. Production data gives you an indication of the solar power system‘s production. The consumption data provides some indication if that electricity is being used for the households’ needs. Solar output may be displayed in an app, but it will be difficult for your app to accurately display how much this output is being consumed by your home without proper metering.
Why Monitoring Matters for Canberra Homes
For Canberra Homes, the importance of Monitoring is essential.
There are seasonal fluctuations in Canberra homes. Strong solar generation can be provided by long summer days, whereas shorter winter days, cloud cover and lower sun angles can result in reduced solar generation. Household demand for energy can also vary by season for energy use in heating and cooling, hot water, and cooking.
Monitoring allows you to compare these patterns that are changing but not assuming. You may find that during the day when the family are out, most of the electricity generated is exported, with power being imported in the evening. Other households might consume a lot of their production as a result of a worker working from home or products being used during the day.
The information can be used to inform practical adjustments. You could run a dishwasher late in the day when the power is available from the sun, or do washing machines when the sun is most productive, or check heating and cooling schedules. The goal is to not waste electricity. The idea is to use more energy your home generates.
Monitoring can also give an early warning that there has been a change. If the production is continually lower in similar weather, the system should be inspected or consult a qualified solar professional.
The Main Figures to Understand
The following are the main figures to understand:
Solar Generation
Generation is the amount of electricity that the panels generate over a period of time. Typical monitoring apps display power in real time in kilowatts (kW) and energy produced from a specific time in kilowatt-hours (kWh). Power is a rate; energy is the quantity of energy produced or used.
Useful reading can be done on a sunny midday, but that’s not an indicator of the entire day’s performance. It is more convenient to compare the pattern with the daily and monthly kWh figures, provided that you take into account weather and seasonal differences.
Household Consumption
Consumption is the electricity consumed by the home’s appliances, lights, heating and cooling equipment and other things. This is typically required to be measured with a compatible consumption meter or energy monitor. In some systems, estimates are given; please consult the application manual for details before assuming that all numbers are accurate.
Knowing about consumption can help identify the peak times for consumption in the home. It can also provide a way to check if routines have been changed and if it has had an impact.
Self-Consumption
Solar self consumption is the electricity generated by the PV system that is consumed within the household. An increase in useful self-consumption might lead to lower electricity consumption from the grid, depending on the tariff and consumption.
For instance, when you have panels generating while someone is running a hot-water system or washing machine, some of that energy might be utilized on-site. The actual outcome will be determined by the demand of the appliances, the output from the solar system and the system configuration.
Grid imports and exports
Grid imports are electricity received from the electricity network when there is more demand than can be produced by the solar and/or battery storage. Exports are the extra electricity that is provided to the network when the generation from the home is greater than the electricity that can be stored in the battery, or consumed by the home.
Imports and exports can be recorded on your electricity meter and/or your electricity retailer bill during a billing period. Compare these numbers with the monitoring data, but note that the app and the bill might have different time intervals or updating.
Battery Activity
If you have a home battery at your home, you may see when it’s charging, discharging and when it’s on its RECHARGE reserve. It can also give you an idea of supply and demand in the daytime, to determine if the battery is storing the surplus generated and drawing on it later. Results are subject to battery capacity, settings, weather, domestic demand and/or any export or charging restrictions.
How Solar Monitoring Works
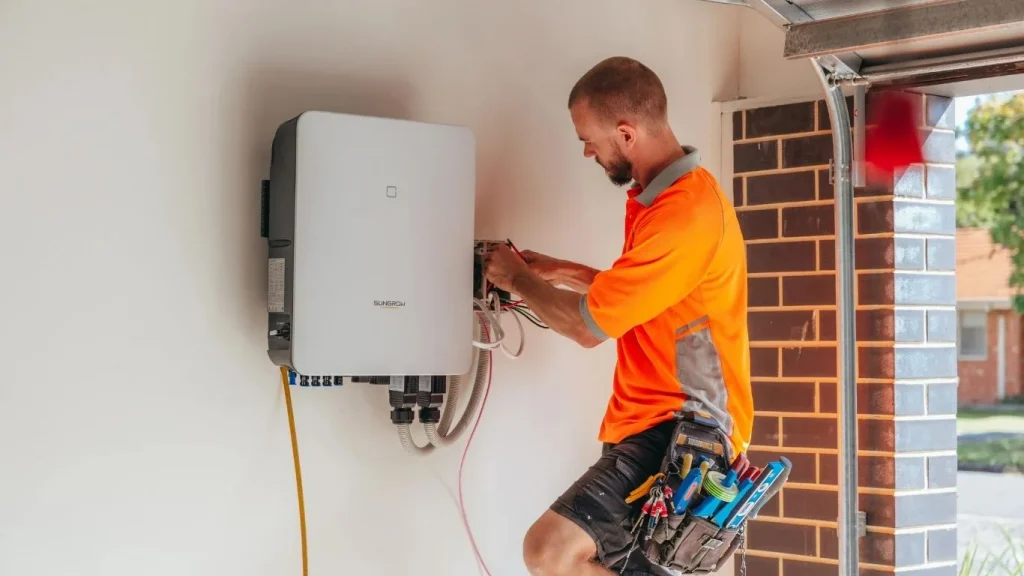
The direct current electric current produced by solar panels. It is then passed through an inverter, which changes the current to an alternating current to be used in the home and fed to the grid. There are differences between inverters and other equipment in terms of monitoring.
Most of today’s inverters are networked with the home internet and share operational data with an app or website. Production, system status, historical graphs and alerts may be displayed on the platform. If a meter or current sensor is to be installed at the switchboard, it is necessary to track the consumption of the households.
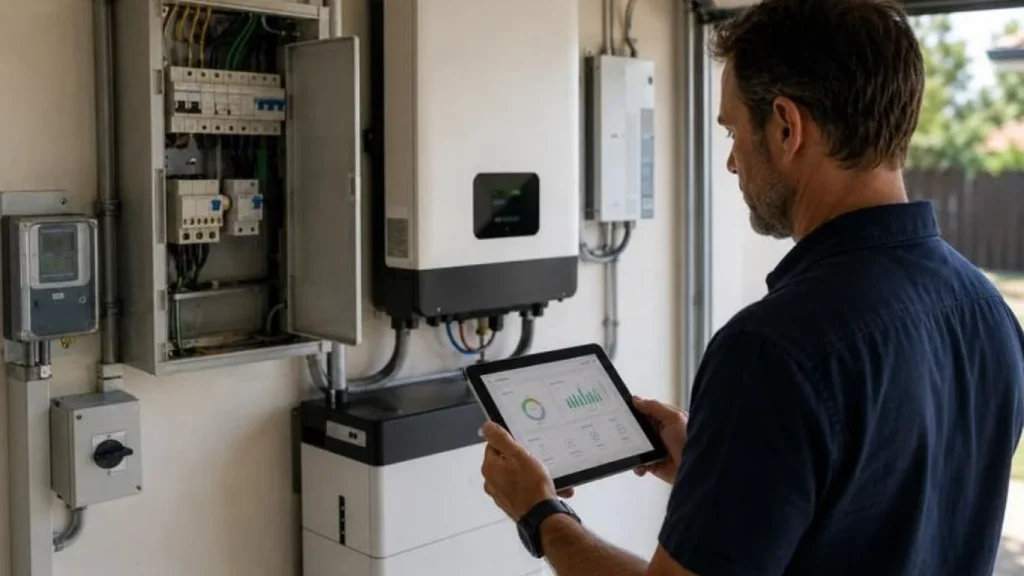
A battery system is usually equipped with its own monitoring system or is compatible with the inverter system. Many homes have an additional energy monitor that allows them to see selected circuits or the entire home. Ask the installer what readings are measured, what are estimated and what additional equipment is required.
The app will update if you have a stable internet connection, but if you get a temporary internet connection problem this does not mean that panels are not generating power. Before assuming a generation fault, please look at the inverter display and system status.
Reading Your Monitoring App
Make a few basic checks first, before attempting to read and understand all the graphs.
First, check out the present generation and contrast it with a comparable day. Compare like with like with a view to weather, cloud and season effects; output will vary. Second, check when your home uses electricity. Know the peak demand times, e.g. early morning, late afternoon or evening. Third, examine the import and export and when the home is on the grid and when excess energy is exported from the home.
If your app offers graphs of this kind, measure solar production against consumption of electricity. If both are going up, there could be a higher percentage of the electricity your home consumes being used directly from the sun. If production is high, but consumption is low, then more energy may be exported. During the night, the generation typically decreases and imports or battery discharge may increase.
Never compare performance between one cloudy day. Search for patterns over the course of a few weeks, and record patterns when changing appliance schedules or system settings. It’s more useful to know the numbers if you tie them to specific household habits.
Making Better Use of Solar Electricity
Shift flexible appliances into daylight hours
Use washers, dishwashers and other similar, flexible appliances when solar power is at its strongest, where possible. If available, use delay-start functions; adhere to appliance safety instructions. The best time will vary with your roof orientation, weather and household schedule.
Manage hot water thoughtfully
Electric hot-water systems consume a lot of energy. Direct use might be increased if the system and tariff allow, and water heating during production. Before adjusting controls or relying on advice from the installer or plumber, please check your controls first, particularly if using a controlled-load tariff or heat-pump system.
Review heating and cooling demand
The heating and cooling load can be significant in Canberra, due to its colder winters and warm summer periods. Monitoring may reveal the peak times of electricity consumption for these systems. If comfort and lifestyle permit, generation can be used during the solar hours by pre-heating or pre-cooling. Avoid setting the temperature too high or too low and do not jeopardise comfort and safety levels for the sake of higher self-consumption numbers.
Coordinate battery settings
Reserve levels, charging schedules and operating modes for the battery can be checked via the authorised app. The optimal setup depends on the electricity rates, backup power requirement, household energy use and the design of the energy system. Don’t alter advanced settings unless you understand what they do, and consult the installer if the battery is not acting as the installer instructed it to do.
Understand Seasonal Changes in Canberra
Soil production varies naturally in response to the sun’s yearly changes. In the summer, longer days can provide more opportunities to generate electricity, but during the winter it is found that there is less daylight and the sun rises and sets at shallower angles. Any season can be impacted by cloud, rain, dust, and nearby trees and roof shading.
Demand from households also fluctuates. COLD weather may cause increased heating usage and SUMMER usage may increase due to air conditioning. A winter bill can thus increase even when the system is running properly: The house might be consuming more energy than it is producing with the solar system.
If performance appears to have deteriorated consider the weather and compare the pattern for the month with similar months in the past. When generation is significantly lower than might be expected given the conditions, investigate further, don’t assume seasonality accounts for it.
Common Monitoring Problems and Warning Signs
If no data is received or a blank app appears, it doesn’t necessarily mean there’s a solar issue, but rather a communications problem. Make sure the home internet connection, app status and inverter display are functioning properly. Please refer to the manufacturer’s troubleshooting instructions, and never disassemble electrical components or remove covers.
If there is no production reported during daylight hours despite repeat monitoring, determine if there is an error message and contact installer or licensed electrician. Do not allow anyone to climb on the roof to check the condition of the panels. Some other times to get professional advice are if the output drops unexpectedly, if the inverter turns off again and again, if there are warning lights that don’t make sense, if there is damage or a burning smell.
Lower production due to cloud, shading, dirt, seasonal changes or fault. There are more issues that can’t be diagnosed by monitoring. A qualified technician can access the system, read error logs and perform testing safely on components.
Record any unexpected readings, dates, weather and error messages. This information may assist a professional in determining if the change is temporary or should be explored.
Monitoring, Electricity Bills and Tariffs
Your monitoring app and electricity bill provide different but complementary information. The app may show generation and estimated household flows, while the bill records the electricity your retailer charges for and any export credits under your plan. Metering intervals, data delays, billing dates and tariff rules can create differences between the figures.
Review the bill for usage rates, supply charges, time-of-use periods and the feed-in tariff offered for exported electricity. A high export total does not automatically mean a high financial return, because the value of exported energy may differ from the price paid for electricity imported later.
If your tariff changes by time of day, compare consumption patterns with the applicable rates. Your retailer can explain billing and meter data; your installer can clarify how your solar monitoring equipment measures energy. Neither the app nor a single bill should be used alone to assess the full value of a system.
Monitoring is most useful when it answers a clear question: when does your home use power, where does solar energy go, and has a pattern changed? Review trends calmly before making decisions.
Conclusion
Solar energy usage monitoring gives Canberra homeowners a clearer picture of how solar generation and household demand work together. By understanding production, consumption, self-consumption, imports, exports and battery activity, you can make practical choices about appliance timing, energy habits and system performance.
Begin with a few reliable readings, compare trends over time and account for Canberra’s seasonal conditions. If the data suggests a persistent fault or you need additional monitoring equipment, speak with a qualified solar professional. A well-understood solar power system is easier to manage, and informed energy use can help you get more value from the electricity your home generates.
Want to make better use of your solar energy? Contact our team for expert advice on Solar Energy Usage Monitoring Canberra and get more insight into your home’s solar performance.
Phone: +61431 262 728
Email: info@wodenvalley.com.au
Website: https://wodenvalleysolarnelectrical.com.au/
Location: Unit 5/5 Tooth St Mitchell ACT 2911